

How much more are ~220,000 MARYLAND ACA enrollees *really* paying this year due to Trump/GOP policies? (with important additional data points)
Wed, 06/10/2026 - 3:00pm
IMPORTANT: See the original post in this series for an explanation of the methodology.
Regular readers know that I've been obsessing over the massive increases in both gross as well as net premiums for ACA health insurance policy enrollees being caused by the combination of Congressional Republicans allowing the enhanced federal tax credits to expire as well as other Trump Regime policy changes for well over a year and a half now.
I've written countless analyses of how much both gross and net premiums skyrocketed from 2025 to 2026 across different states, different income levels and various other demographics...and last week it was revealed that over 3 million ACA exchange enrollees had already been priced out of the market as of April, with the number almost certain to climb further throughout the rest of 2026.
As I've repeatedly warned, however, the increases in premium costs (whether gross or net) are only half the story. The other big shoe which is dropping this year is increased out of pocket costs as millions of the ~19.2 million or so remaining enrollees as of April have been forced to downgrade their coverage to avoid (or at least minimize) those massive premium spikes.
In most cases this means moving to plans with higher deductibles, higher co-pays & higher coinsurance costs. In many cases this has also included moving to plasn with worse networks, referral requirements to see specialists and so on.
With that in mind, that's exactly what I've decided to set out to do: Calculate the average year over year increase not just in net premiums (that is, how much more ACA enrollees are having to pay each month) but also the year over year change in average out of pocket costs.
Let's look at MARYLAND:
- NOTE: I have additional effectuated data for Maryland as of April which lends some insight into how things can shift from Open Enrollment as the year progresses. I'll get to that after the main analysis.
- It's also important to keep in mind that Maryland is one of the states providing additional state subsidies to backfill at least some of the lost federal tax credits this year. In fact, they've had an existing state subsid program in place for younger enrollees only for several years now which they've dramatically expanded this year. I'll get into the details of this below.
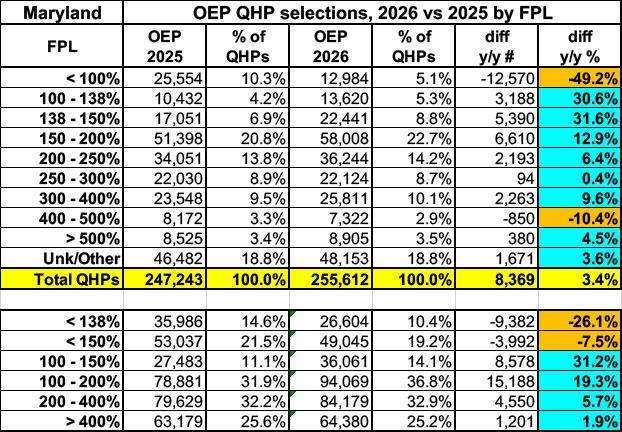
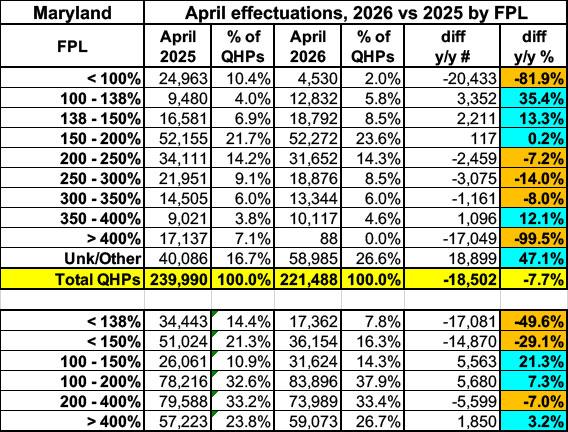
Here's the ACA exchange plan selections during Open Enrollment by household income level this year vs. last.
As expected, enrollment has dropped by nearly 10% overall, due mostly to the expiration of the enhanced federal subsidies as well as the Trump Regime eliminating federal subsidy eligibility to low income legally-residing immigrants who have been U.S. residents for less than 5 years, along with some other categories of documented immigrants.
Enrollment below 100% FPL and over the 400% FPL threshold have dropped dramatically, by ~37% and 41% respectively.
OK, onto the main analysis:
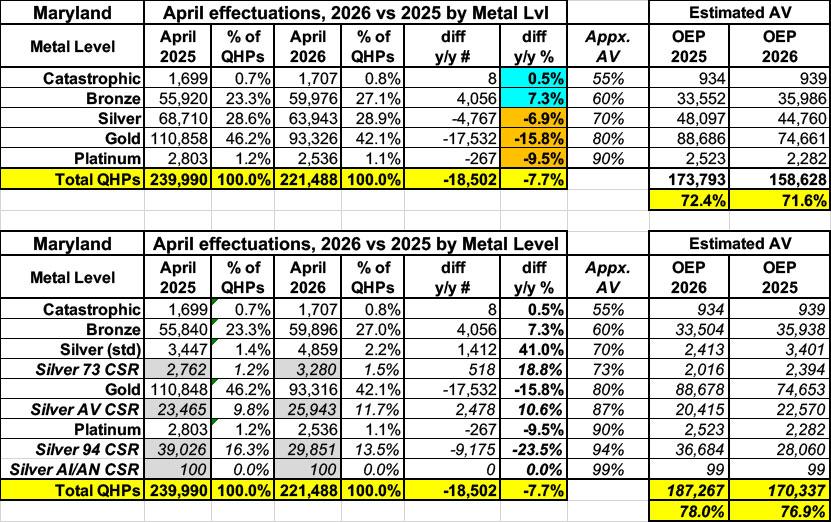
Here's total Open Enrollment plan selections for both 2025 & 2026 broken out by Actuarial Value (AV) category. The first table is based on official metal level tiers, but it's the second table which is critical, since a huge chunk of ACA enrollees are usually enrolled in CSR Silver plans (which include Cost Sharing Reduction assistance). CSR assistance dramatically boosts the AV of Silver plans up to Platinum levels in most cases.
In the end, the average AV, which is the measure of what percentage of total medical costs a plan covers (in aggregate, not individually) has dropped by about 1 point year over year, from 77.8% to 76.8%. This is a nominal drop, presumably thanks to the state subsidy program which caused many enrollees to not be forced into downgrading their coverage.
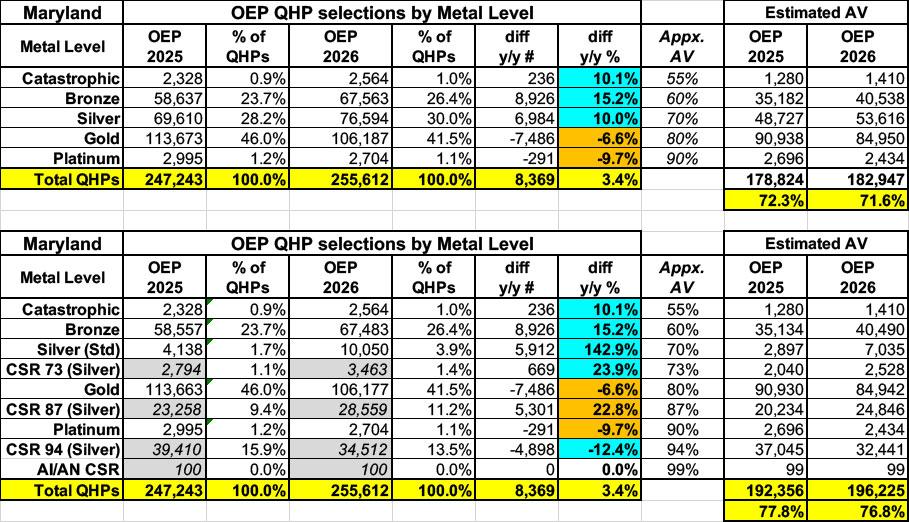
IMPORTANT: I only have detailed CSR category enrollment data for the 30 states hosted via the federal ACA exchange, HealthCare.Gov. Unfortunately, the Centers for Medicare & Medicaid Services (CMS) only provides total CSR enrollment for most of the 21 state-based exchanges (SBEs).
For these states, which includes Maryland, I'm instead relying on rough estimates based on the percent of enrollees in the 100 - 150%, 150 - 200% and 200 - 250% FPL income brackets who selected Silver plans each year, which can be found in the 2025 & 2026 OEP State, Metal Level, and Enrollment Status Public Use Files (ZIP) from CMS.
These percentages, when converted into raw numbers, correspond fairly closely to the actual CSR category breakouts for FFM states (+ or - 5%), so they should be close enough for my purposes. I've also come up with rough estimates for the AI/AN CSR category based on comparisons of the percent of AI/AN CSR QHPs selected in FFM states to the percent of AI/AN residents within each state. This is less than 3.3% in every SBE state except for New Mexico.
Again, these are broad estimates only but should be reasonably accurate for this project.
As noted above, Maryland is one of the states with their own supplemental subsidy program for ACA exchange enrollees. Last year the program was limited to enrollees age 18 - 37 who earn less than 400% FPL. I used the 2026 enrollment report from the MD Health Benefit Exchange to estimate the average net premiums per member after the state subsidies were applied, and it comes in at around $168 per member per month:
For 2026, however, they vastly expanded the program to also backfill 100% of all lost federal subsidies for enrollees who earn from 100 - 200% FPL, the gradually phased this down to 50% of lost tax credits from 200 - 250% FPL, and finally, 50% of lost subsidies from 250 - 400% FPL.
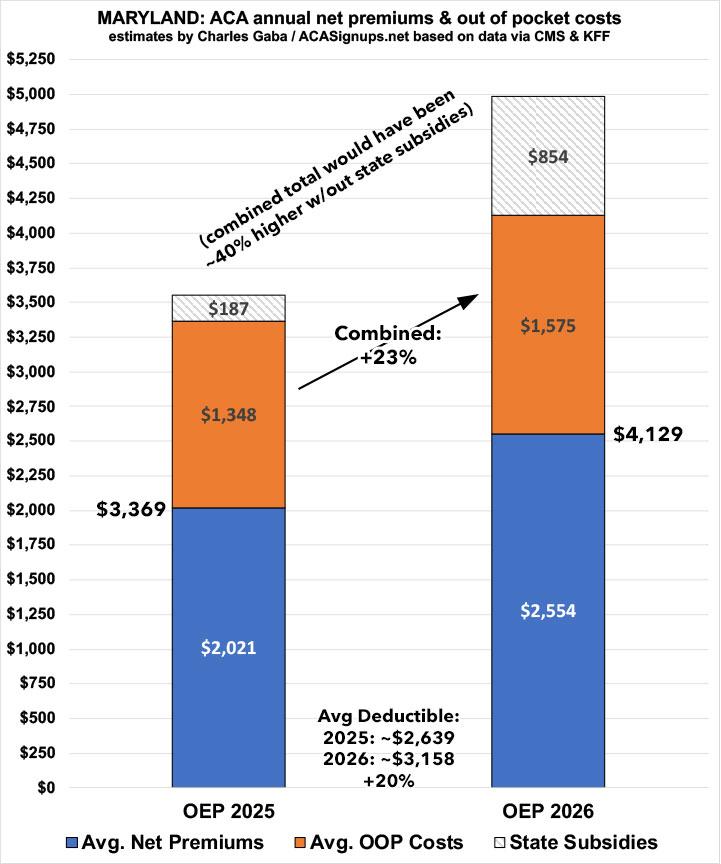
By doing this, they've knocked the average net premium per enrollee down from $284 with federal subsidies only to $213 per enrollee per month...saving an extra $854 per enrollee.
By combining these numbers with the average gross premiums per enrollee I'm able to calculate an estimate of the average total medical expenses each enrollee racks up each year assuming an 80% average Medical Loss Ratio (as I stated in the original post, this can vary widely by carrier and year, so should be considered a very broad average only), which looks like so:
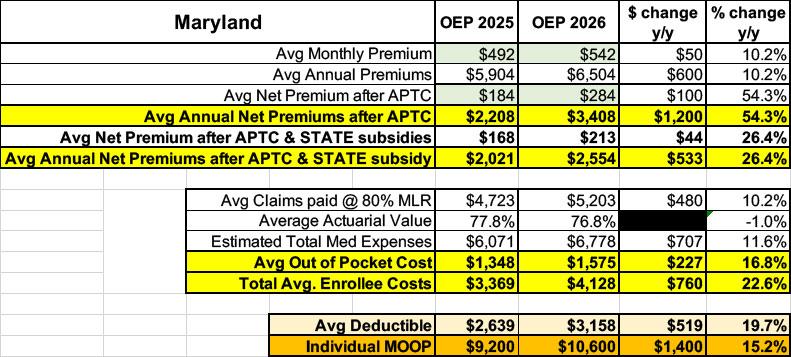
The ~255,000 enrollees who signed up during Open Enrollment would have seen their net premiums skyrocket by more than 54%; thanks to the state subsidies, the increase is a much lower (but still painful) 26% on average.
In addition, their average out of pocket expenses have gone up ~17%, for a combined average healthcare cost increase of ~23%.
That's an increase from over $3,400 to $4,100 per enrollee this year...over around $670 more apiece.
In addition, based on KFF's net data, average deductibles also went up by ~20% to ~$3,100 for single coverage this year, and the maximum (theoretical) out of pocket cut-off for all ACA enrollees went up by over 15% this years as well, to $10,600 for single coverage.
The bar graph below visualizes this, demonstrating how much of a positive impact the state subsidies have had:
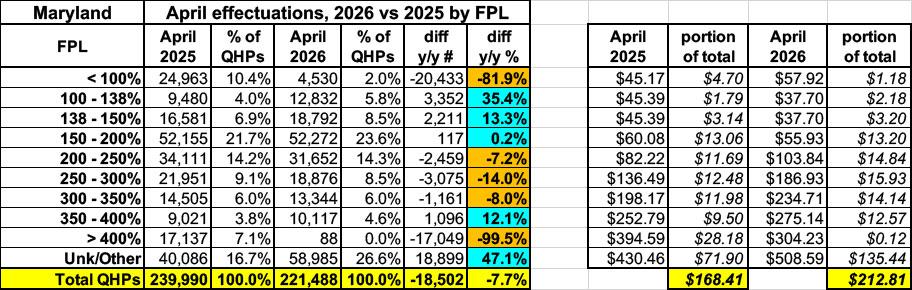
HOWEVER, as noted above, I have some more recent data thanks to Maryland's monthly enrollment reports having detailed demographics as well!
As of April 2026, effectuated enrollment on Maryland's exchange went from being 3.4% higher than last year to 7.7% lower...a net shift from ~8,300 more enrollees to ~18,500 fewer effectuated enrollees than the same point a year earlier. That's a net swing of nearly 27,000 enrollees:
Interestingly, while enrollment saw a dramatic drop and there were shifts in the proportion enrolled at different income levels and metal levels, it doesn't seem to have shifted the overall average Actuarial Value by much in either year:
Next up: MASSACHUSETTS.
Advertisement